Five years ago, in 2020, Steffen Strunge Mathiesen, master’s student in Computer Science at Aarhus University, approached Assoc. Prof. Hans-Jörg Schulz with an unusual thesis topic. Through a course project in Schulz’ Data Visualization class, Steffen had become fascinated by Stacked Area Charts - and he had an idea for how to improve them.
The resulting layout algorithm, UpwardsOpt, became the focus of his thesis and was published a year later at DIAGRAMS’21 - the 12th International Conference on the Theory and Application of Diagrams. Recently, a team of algorithm researchers from TU Wien, Austria, independently verified its performance. In their June 2025 preprint, they concluded: “The state-of-the-art heuristic UpwardsOpt is well-suited for Weighted-1-WiggleMin for real-world instances, even though the problem is computationally very hard in the theoretical sense.”
Stacked Area Charts are widely used in graphing packages and spreadsheets. They display multiple time series stacked on top of each other - for instance, sales from different company divisions. This allows readers to see both the overall trend and the breakdown across divisions. But the order of the layers matters: while the total sum remains the same, some orders are much easier to read than others. Ideally, one wants to minimize “wiggle” - layers moving up and down unnecessarily.
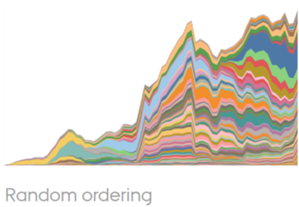
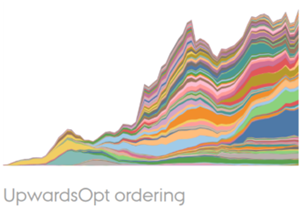
Finding the best order of layers - the so-called Weighted-1-WiggleMin problem - is computationally challenging. Before Mathiesen’s work, the best algorithms could only guarantee that no layer swap with a direct neighbor would improve the chart. Mathiesen’s optimization method went further: it ensured that no layer could be removed and reinserted anywhere else in the stack to yield a better diagram.
As TU Wien’s evaluation shows, UpwardsOpt finds the optimal solution in one third of all tested cases and comes very close in the rest. This makes it the current state-of-the-art algorithm for generating Stacked Area Charts.
Assoc. Prof. Hans-Jörg Schulz, who supervised the thesis and co-authored the original paper, sees this as a triumph for open science:
“This is exactly how computer science research should be conducted. We built the algorithm, published it, and made all materials freely available — the paper, source code, benchmark data, and supplementary notes. That made it easy for colleagues at TU Wien to build on our work and run much more extensive tests than we could have done within the four months of an MSc thesis project. It’s really a win-win.”
And UpwardsOpt is already finding use beyond research. For example, it has been applied to produce clearer visualizations of clinical test results for patients.
For more information about data visualization or the UpwardsOpt algorithm, contact Assoc. Prof. Hans-Jörg Schulz or visit the project website: https://vis-au.github.io/stackedcharts/

