In late fall 2022, three of our researchers hatched a plan: Assoc. Prof. Hans-Jörg Schulz (Data Visualization), Assoc. Prof. Davide Mottin (Data Mining), and Assist. Prof. Ken Pfeuffer (Extended Reality) gathered a team of eight MSc students and four PostDocs to participate in the 2023 IEEE SciVis Contest – the world’s toughest and most prestigious competition in scientific data visualization. This year, the contest consisted of visualizing brain simulation data – a challenge that our team tackled by developing an innovative immersive visualization and exploration tool. After an international panel of six judges ranked all contest entries, the result was announced this week at the IEEE VIS conference in Melbourne, Australia. We are proud that our team from Aarhus University came in second overall, and on top, won the award for the “most innovative work” submitted to the contest. Congratulations to the whole team!
This year’s contest was to visualize ~50 GBytes of brain simulation data. These data consist of hundreds of thousands of neural structures from different time points of the simulation – each with thousands of neurons and their connecting synapses, dendrites, and axons, but also various parameters like calcium levels, electric activity, and firing rates. The challenge was to devise a data visualization to observe changes in the neural network and its behavior under various scenarios. In one scenario, for example, regions of the simulated brain were deactivated as if injured after an accident to see whether and how other regions of the neural network adapt to take over its function. More information about the contest itself can be found at the contest website: https://sciviscontest2023.github.io
Interdisciplinarity was key in our contest team. To tackle this challenge, our team combined three different disciplines of Computer Science: Data Mining for the efficient preprocessing, storage, and retrieval of the vast dataset; Visualization for the expressive graphical representation of those data; and Virtual Reality to effectively bring these visualizations to life and let the domain experts step right into the data for their interactive analysis. Only with this cross-cutting mix of expertise from VR hardware and computer graphics to graph databases and machine learning, our team was able to create the cutting-edge solution they submitted to the contest after five months of work in July. In addition, they relied on domain expertise from AU’s Center of Functionally Integrative Neuroscience and on the virtual studio of AU’s Center for Advanced Visualization and Interaction.
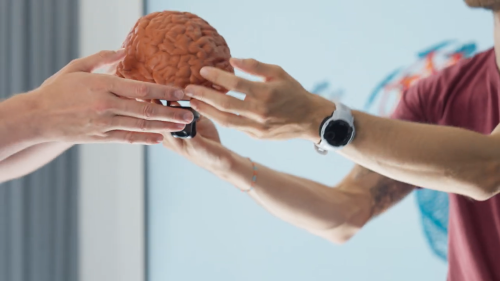
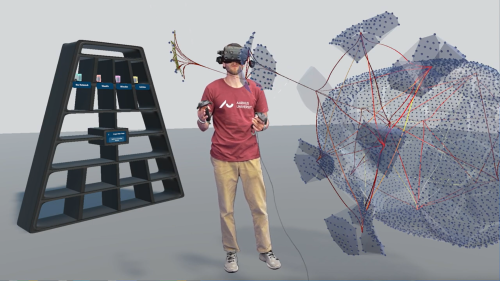
Their final visualization solution is a virtual space that is as large as needed for the analysis of the brain data. Multiple instances of the simulation can be placed in this virtual space, for example, different time points of the simulation or different perspectives on the brain at the same time. Unimportant neurons (e.g., with low calcium levels or low electric activity) can be interactively filtered, and regions of interest can be unfolded in an “exploded view” showing more and more details with every level. Once the expert has found an interesting part, a novel “format painter” mechanism, as it is known from office software, can be used to copy the current view configuration over to other brains in the virtual space, so that they show the same filtering and unfolding and can be easily compared with each other. A 3D-printed brain acts as a tangible interaction prop providing anatomical context when presenting findings from VR in a collaborative setting. This solution is in many ways groundbreaking. It does not only extend and improve existing algorithms – for example, by making the fast computation of perceptually important points even faster or by considering connection counts in the 3D edge-bundling algorithm that originally does not allow for this. It also explored entirely new ideas like the format painter interaction in VR or the 3D-printed, tangible interaction prop. Further materials, details, and background information on the built solution can be found here: https://vis-au.github.io/scivis23/.
For the researchers involved, the joint work on the contest entry presented a welcome opportunity to mesh their methods and algorithms with each other. Does the clustering algorithm that performs well in benchmarks also hold up in a practical setting like this? Can the visualization technique that was developed for 2D screens be adapted for the third dimension in VR? Does an interaction technique in VR break down if it has to work with a lag of 1-2 seconds of waiting for the data to be fetched from the backend? Much too often research is done in isolation, and the moment database methods, visualization techniques, and VR hardware need to be combined, new challenges and interesting problems emerge that require novel solutions. In that sense, the contest will, in many aspects, be a steppingstone for more joint research to come. For the students in the team, the contest provided them with a unique possibility to see their MSc projects and theses contribute to a greater, joint software framework. It is rare that students specializing in databases see their algorithms at work in an interactive visualization, where the performance they achieve directly influences the output quality of the graphics and the smoothness of interaction with the user interface. Likewise, no student specializing in VR will likely ever get the chance to build interactive visualizations for a 50 GByte dataset, simply because the overhead of managing such large amounts of data is normally beyond the scope of an MSc student project. Working together on the contest entry – whether on the visible frontend or on the invisible backend – gave everyone a huge drive to excel and push their individual parts of the immersive visualization framework as far as possible.
Most certainly! After winning the Cybercartography Competition 2022 and now the 2nd place in the IEEE SciVis Contest 2023, there is for sure another contest entry coming to show off our world-class data visualization research and education here at the Department of Computer Science. Stay tuned!

