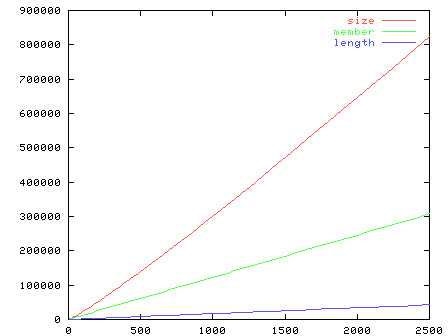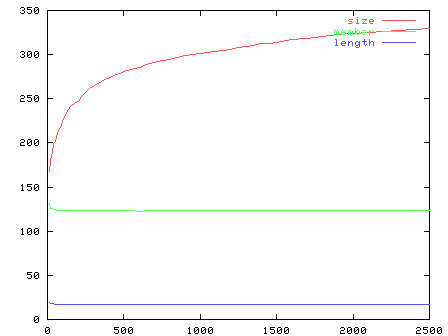

We counted the number of reductions required for
Source code: search_tree.hs.
The resulting graph is values from the experiments are contained in the figure below. In the second figure we have plotted the values divided by n. The red curve can be approximated by the function 80n+32nlog n, which matches the expected O(nlog n) time for building a search tree.


| n | Reductions | ||
|---|---|---|---|
| size | member | length | |
| 10 | 1673 | 1314 | 196 |
| 20 | 3626 | 2524 | 366 |
| 30 | 5681 | 3772 | 536 |
| 40 | 7976 | 4962 | 706 |
| 50 | 10063 | 6210 | 876 |
| 60 | 12441 | 7412 | 1046 |
| 70 | 14947 | 8624 | 1216 |
| 80 | 17311 | 9912 | 1386 |
| 90 | 19814 | 11146 | 1556 |
| 100 | 22561 | 12352 | 1726 |
| 125 | 29279 | 15469 | 2151 |
| 150 | 36130 | 18504 | 2576 |
| 175 | 42817 | 21605 | 3001 |
| 200 | 49496 | 24763 | 3426 |
| 225 | 56732 | 27884 | 3851 |
| 250 | 64219 | 30915 | 4276 |
| 275 | 71861 | 33912 | 4701 |
| 300 | 79237 | 36975 | 5126 |
| 325 | 86873 | 40072 | 5551 |
| 350 | 94081 | 43111 | 5976 |
| 375 | 101989 | 46186 | 6401 |
| 400 | 109258 | 49199 | 6826 |
| 425 | 116791 | 52286 | 7251 |
| 450 | 124870 | 55343 | 7676 |
| 475 | 132331 | 58525 | 8101 |
| 500 | 140567 | 61695 | 8526 |
| 550 | 155636 | 67615 | 9376 |
| 600 | 171513 | 73733 | 10226 |
| 650 | 187752 | 79939 | 11076 |
| 700 | 203837 | 86085 | 11926 |
| 750 | 219667 | 92265 | 12776 |
| 800 | 235876 | 98409 | 13626 |
| 850 | 251933 | 104563 | 14476 |
| 900 | 268719 | 110627 | 15326 |
| 950 | 285231 | 116775 | 16176 |
| 1000 | 301303 | 122931 | 17026 |
| 1050 | 317234 | 129123 | 17876 |
| 1100 | 333564 | 135327 | 18726 |
| 1150 | 350793 | 141473 | 19576 |
| 1200 | 367562 | 147725 | 20426 |
| 1250 | 384818 | 153843 | 21276 |
| 1300 | 401724 | 160087 | 22126 |
| 1350 | 419302 | 166217 | 22976 |
| 1400 | 436922 | 172319 | 23826 |
| 1450 | 453654 | 178443 | 24676 |
| 1500 | 471395 | 184509 | 25526 |
| 1600 | 507115 | 196741 | 27226 |
| 1700 | 541711 | 209029 | 28926 |
| 1800 | 577284 | 221349 | 30626 |
| 1900 | 612602 | 233688 | 32326 |
| 2000 | 647242 | 245864 | 34026 |
| 2100 | 682143 | 258190 | 35726 |
| 2200 | 716628 | 270484 | 37426 |
| 2300 | 752228 | 282778 | 39126 |
| 2400 | 788554 | 295170 | 40826 |
| 2500 | 824566 | 307446 | 42526 |